


Grow Data on the Inform Dashboard
This article provides information about the Grow data on the Inform Dashboard.
Grow Summary Metrics provide information about how many groups were actively running, how many unique grow leaders led a group, and on the number of unique participants in all Grow groups at any point during a selected time frame.
Grow Transition Trends provide information about the percent of those participants who continued on to additional Grow/ Encounter experiences during the selected timeframe. It also provides information on the percentage of those who transitioned from a participant to a leader.
Complete these steps to locate and view the Grow data on the Inform Dashboard card:
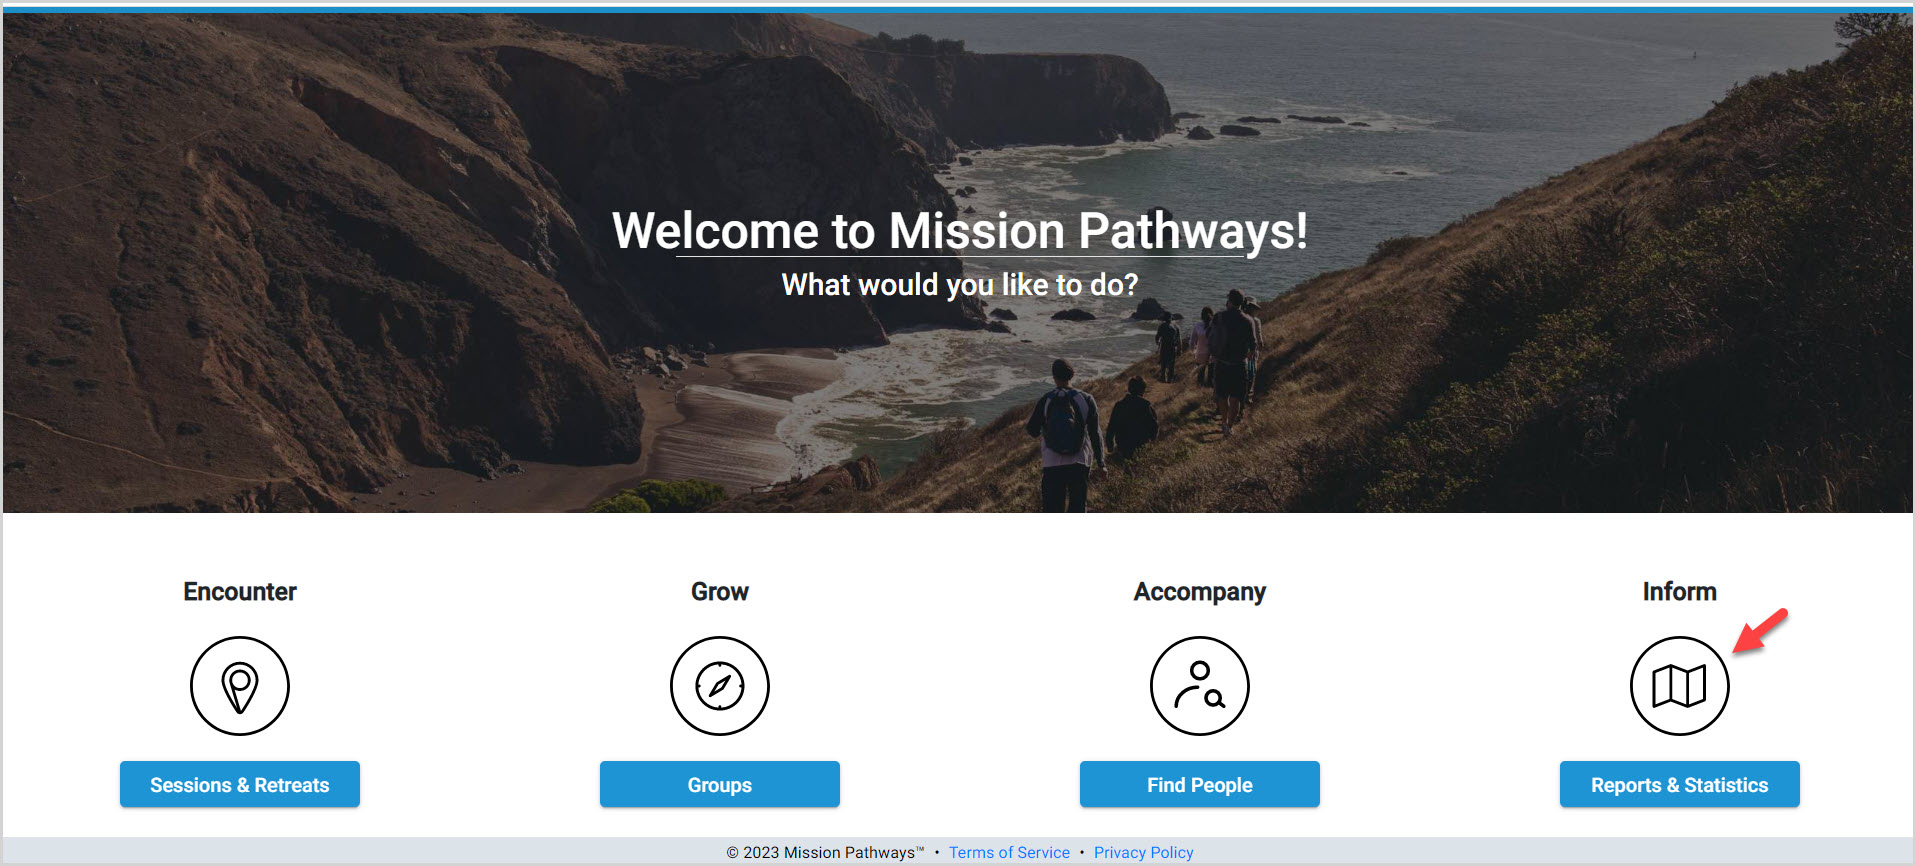
1. From the homepage, click on Inform Reports and Statistics.
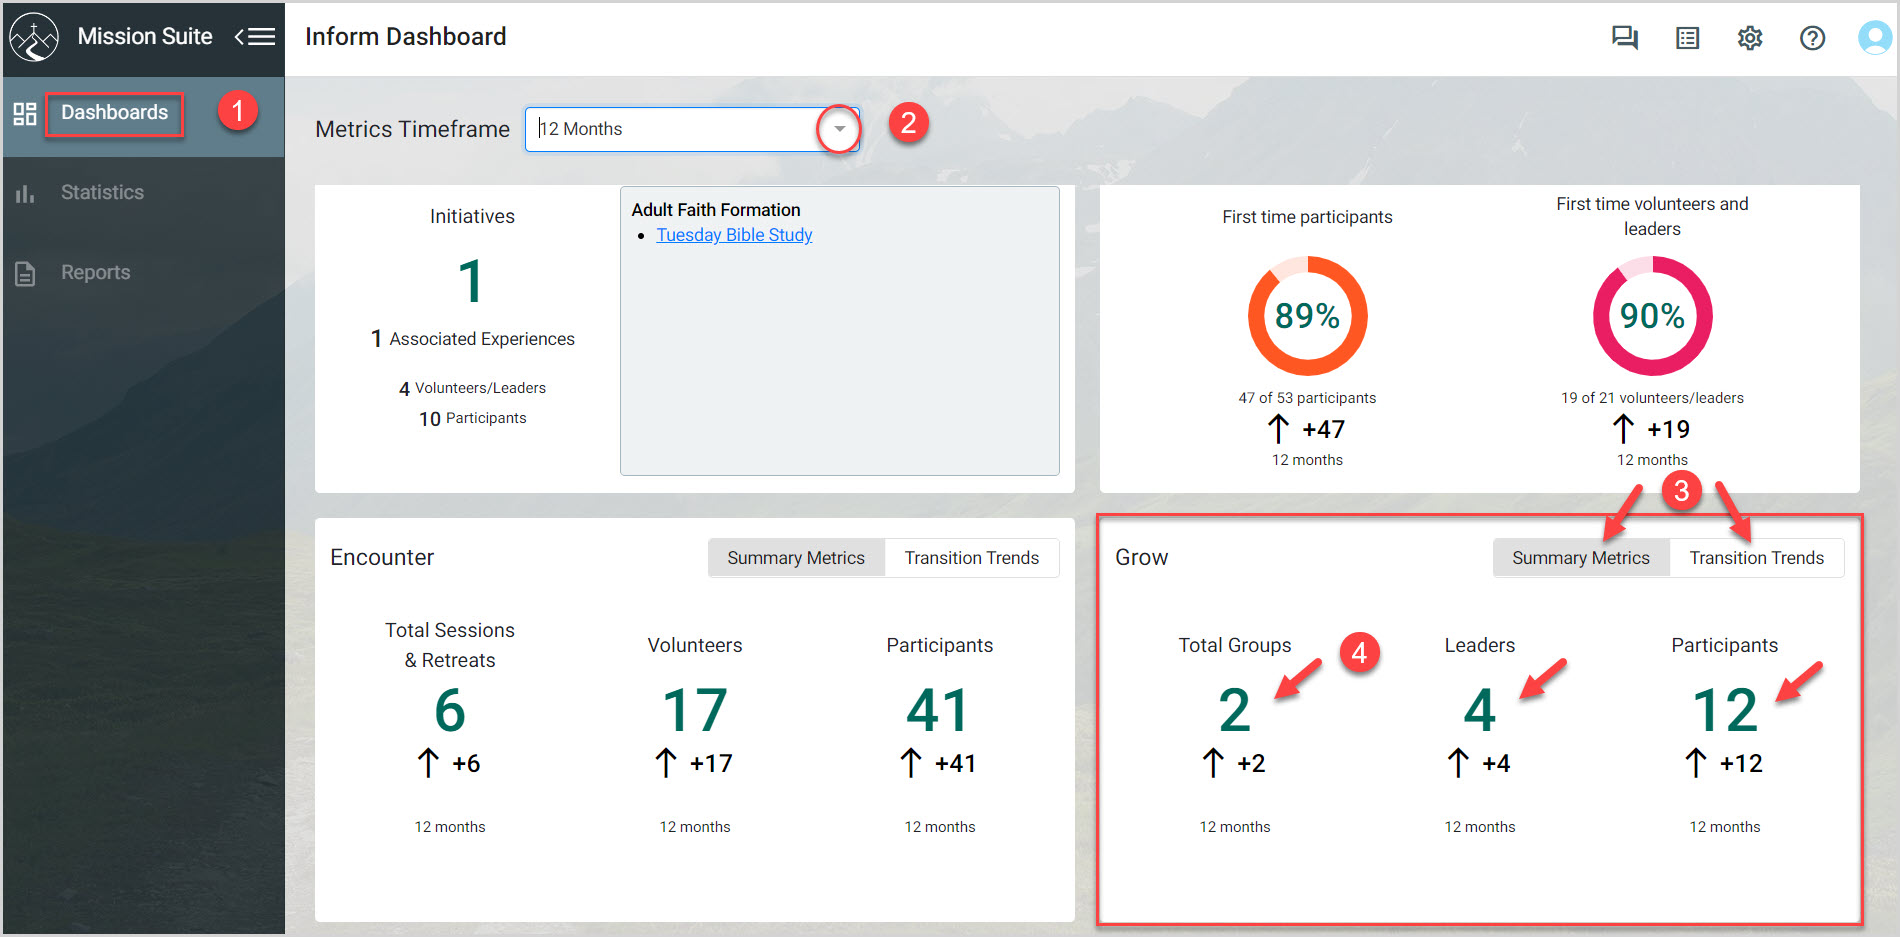
2. On the dashboard card, click on the Metrics Timeframe drop-down menu to view the time frame options and select either Current Church Calendar Year, 6 Months, or 12 Months.
3. Click on the Summary Metrics tab or the Transition Trends tab to see statistics as desired.
4. Click on any individual statistic on any dashboard card to view a pop up card with a more in depth description.
Grow Data Summary Metrics
Note* Click on each statistic (2, 4, and 12) for Grow on the Summary Metrics dashboard card to view a pop up card with an explanation of the data point.
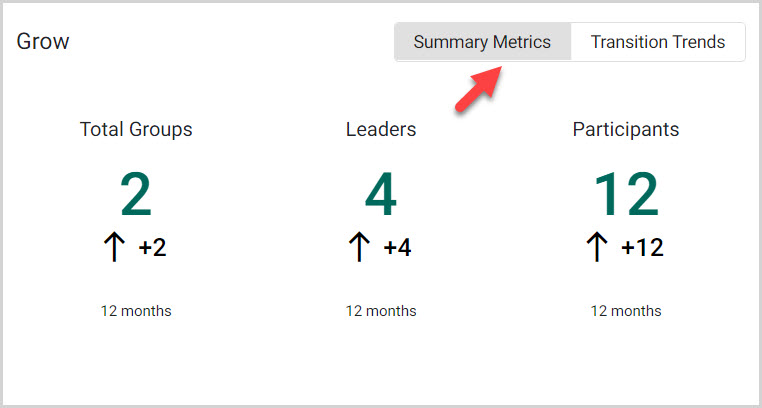
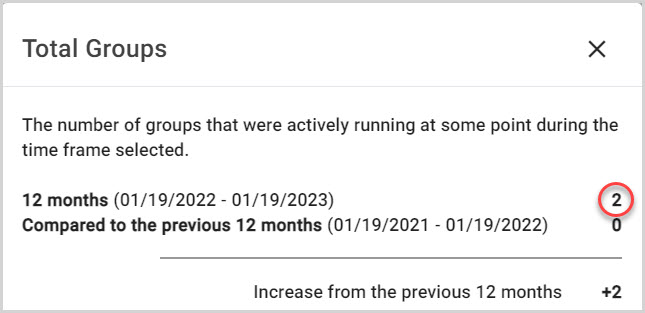
In this example, there were two groups in total actively running at some point during the 12 month time frame selected compared to zero groups from the same previous 12 month period, resulting an increase of two groups over the previous 12 months.
There were 4 unique Grow leaders who led a group at some point during the 12 month time frame selected compared to zero groups from the same previous 12 month period, resulting in an increase of four unique Grow leaders over the previous 12 months.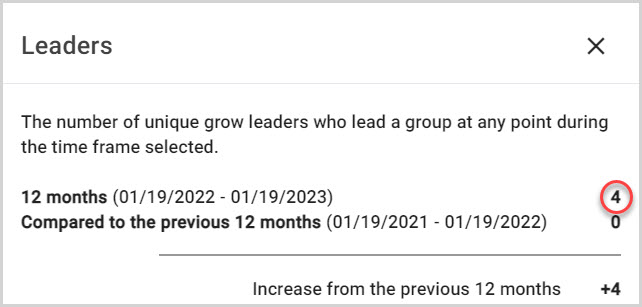
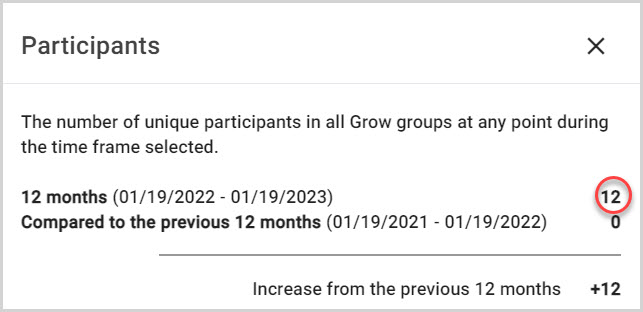
There were 12 unique participants in all Grow groups at some point during the time frame selected compared to zero groups from the same previous 12 month period, resulting in an increase of 12 unique participants in all Grow groups over the previous 12 months.
Transition Trends
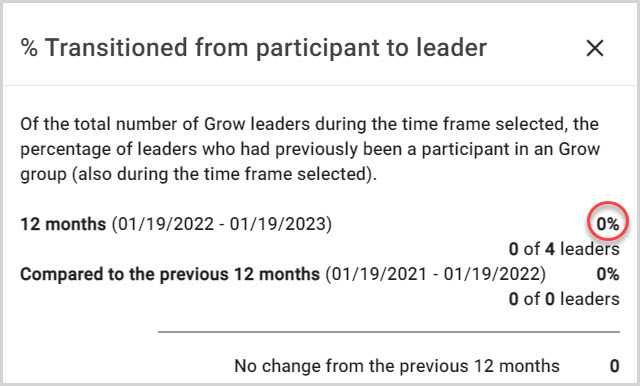
Note* Click on each statistic (6% and 0%) for Grow on the Transition Trends dashboard card to view a pop up card with an explanation of the data point.
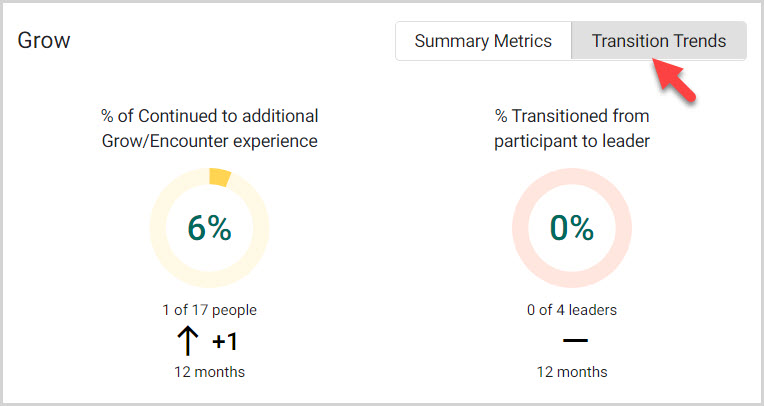
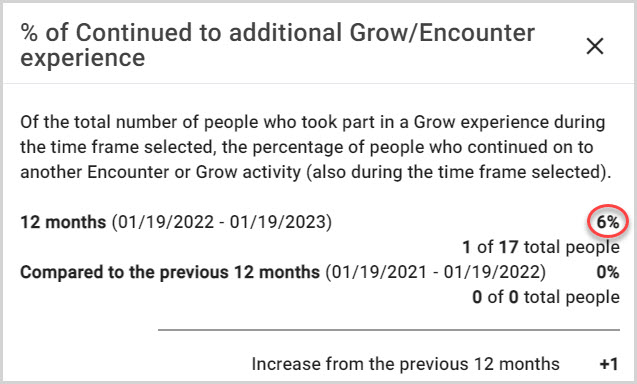
In this example, in 12 months one of 17 people, which is 6% of the people, continued on to an additional Grow/Encounter experience, resulting in an increase of 1 person who continued on to another Encounter or Grow activity over the previous 12 months.
Compared to the previous 12 months, zero percent of the participants transitioned from participant to leaders. Subsequently, there was no change from the previous 12 months, resulting in an increase of zero Grow leaders transitioning from participant to leader over the previous 12 months.
Click here to learn more about the Inform Reports and Statistics Dashboard.
Note* The video is best viewed at full screen. Press Esc on your keyboard when you are finished viewing.