


Experience Measures Data on the Inform Dashboard
This article provides information about the Experience Measures data on the Mission Pathways Inform Dashboard.
Who were first time participants of an Encounter or Grow experience? What was the percentage of those people who had never volunteered or lead before this Encounter or Grow Experience? Experience Measures - Engagement can segment that information out and provide that data for you.
How many members were involved in a specific Encounter or Grow experience and how many of those who attended were non members? The Experience Measures - Reach information on the Inform Reports and Statistics Dashboard can tell you how many of those who attended an Encounter or Grow experience were members vs non-members.
Complete these steps to locate and view the Inform Reports and Statistics Systems Experience Measures dashboard card:
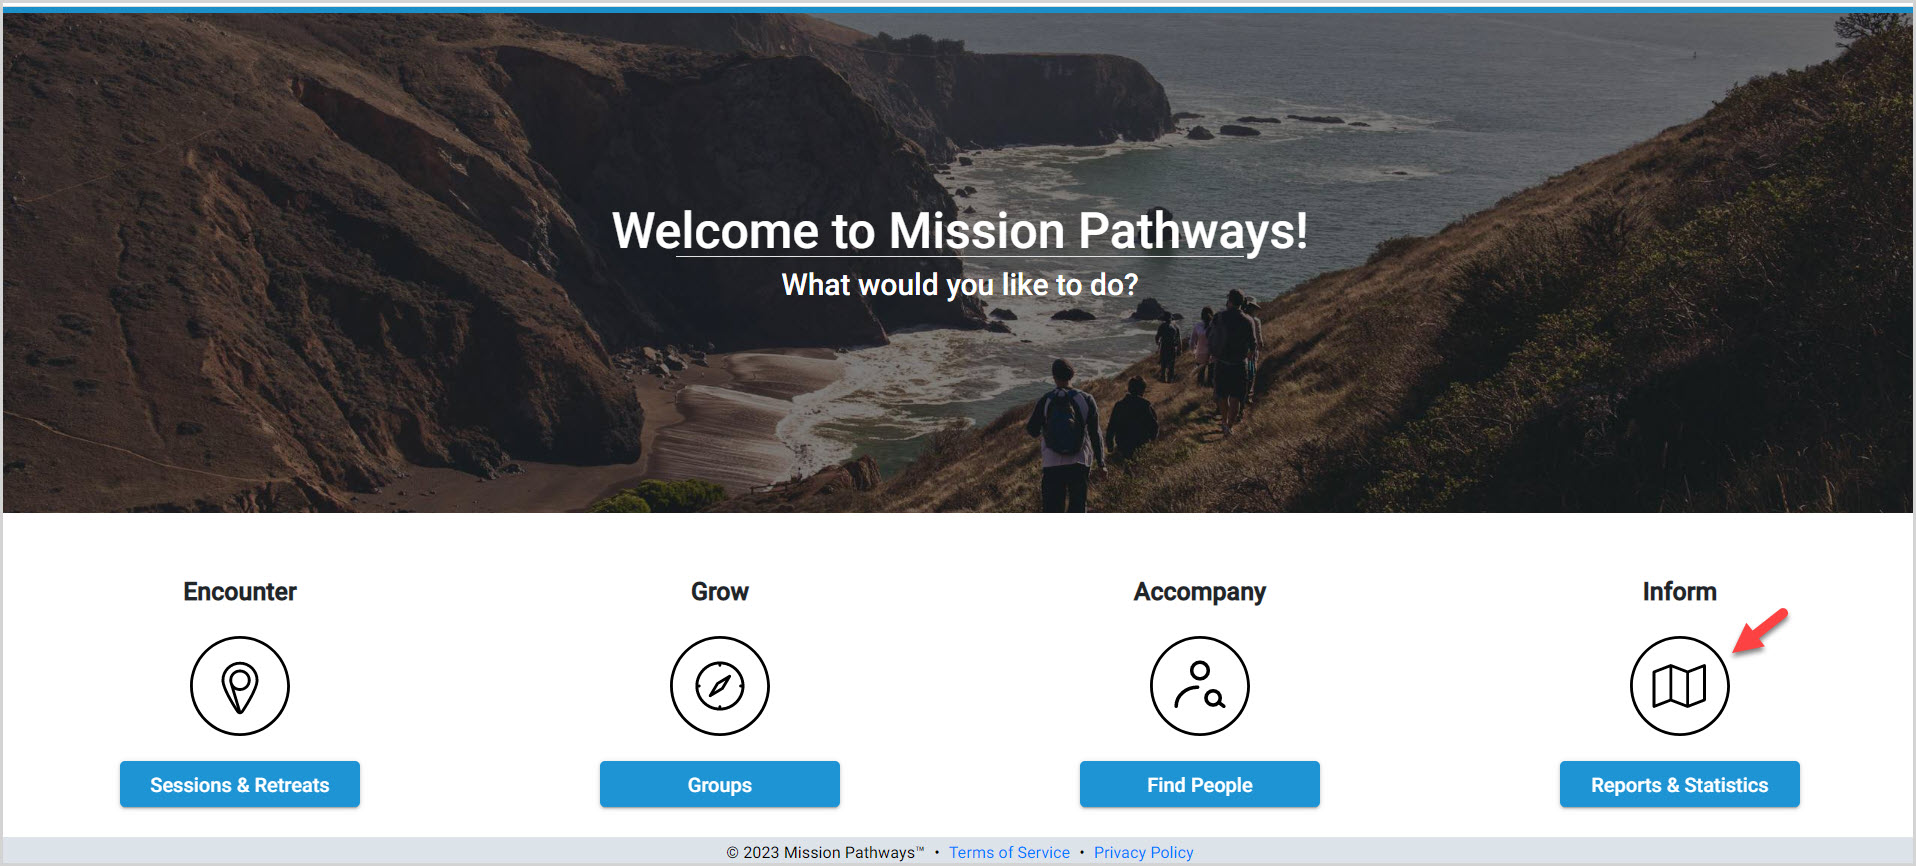
1. From the homepage, click on Inform Reports and Statistics.
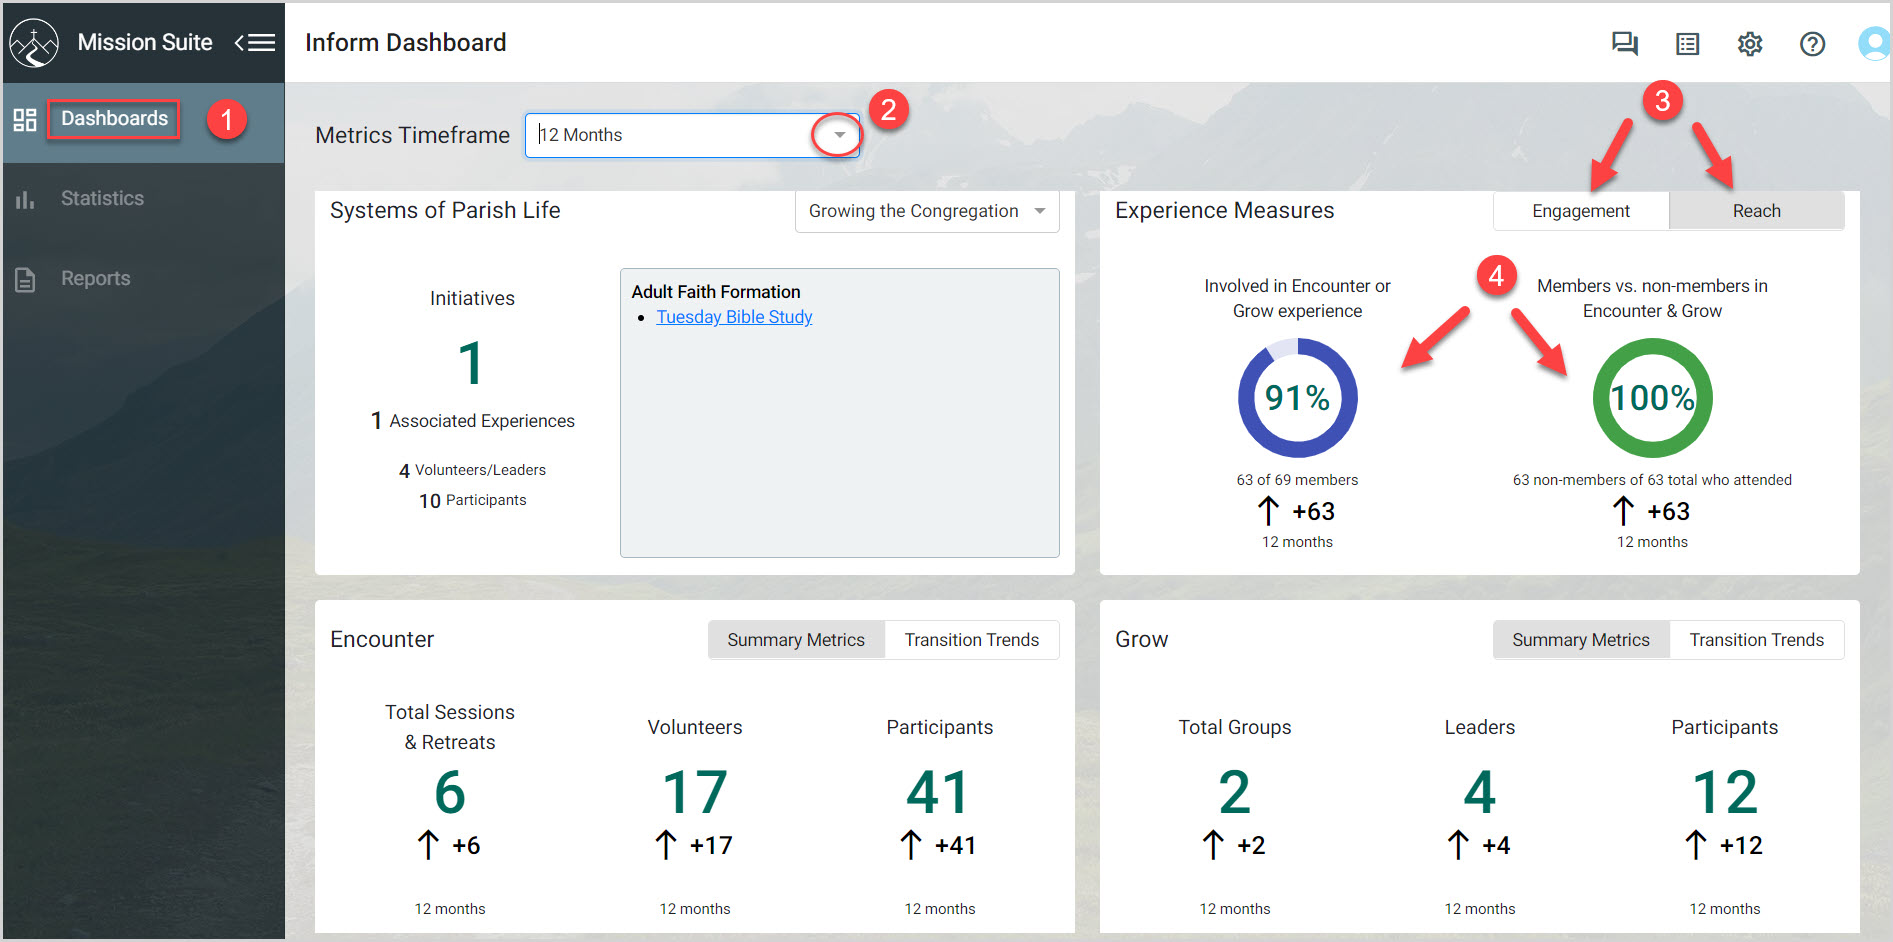
2. On the dashboard card, click on the Metrics Timeframe drop-down menu to view the time frame options and select either Current Church Calendar Year, 6 Months, or 12 Months.
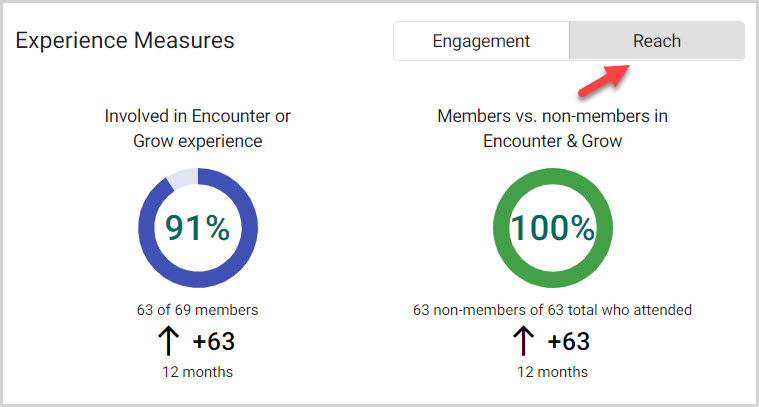
3. Click on the Engagement tab or the Reach tab to see statistics as desired.
4. Click on any individual statistic on any dashboard card to view a pop up card with a more in depth description.
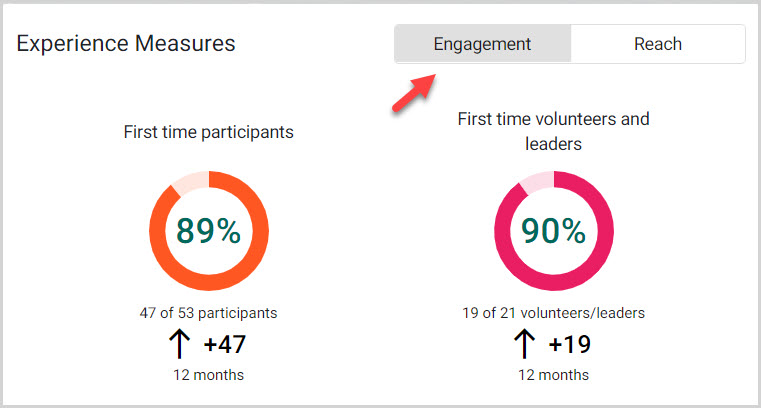
Experience Measures - Engagement
These numbers do not reflect people who previously had the role of volunteer or leader. This example, measuring Engagement represents a 12 month review indicating that 89% of the participants, which were 47 out of 53, were first time participants. That is an increase of 47 people over the previous year.
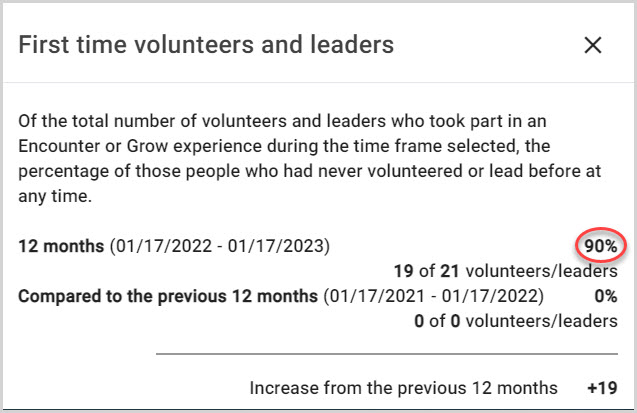
This card also presents metrics for first time volunteers and leaders. It indicates that 90% of the volunteers and leaders, which were 19 out of 21, were first time volunteers and leaders. That is an increase of 19 people over the previous 12 months.
Note* Click on each statistic (89% and 90%) on the Experience Measures Engagement dashboard card to view a pop up card with an explanation of the data point.
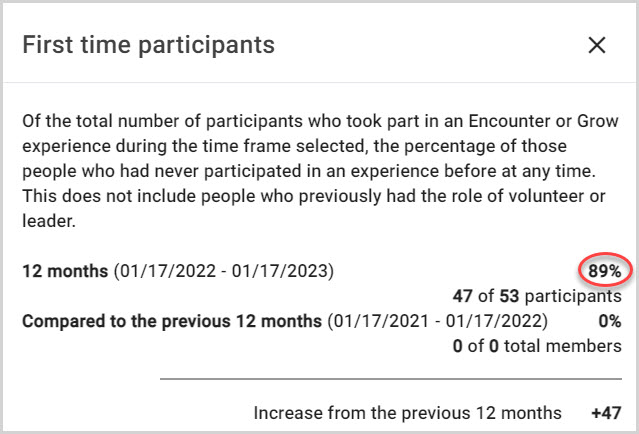
How many were first time participants? (This number does not include those who previously had the role of volunteer or leader.)
In this example there were 53 participants, 43 of whom took part in an Encounter or Grow experience at some point during the 12 month time frame selected compared to 0 participants from the same previous 12 month period, resulting in an increase of 89% for participants who had never participated in an experience before over the previous 12 months.
How many were first time volunteers and leaders?
In this example there were 21 volunteers and leaders, 19 of whom took part in an Encounter or Grow experience at some point during the 12 month time frame selected compared to 0 volunteers from the same previous 12 month period, resulting in an increase of 90% for volunteers and leaders who had never participated in an experience before over the previous 12 months.
Experience Measures - Reach
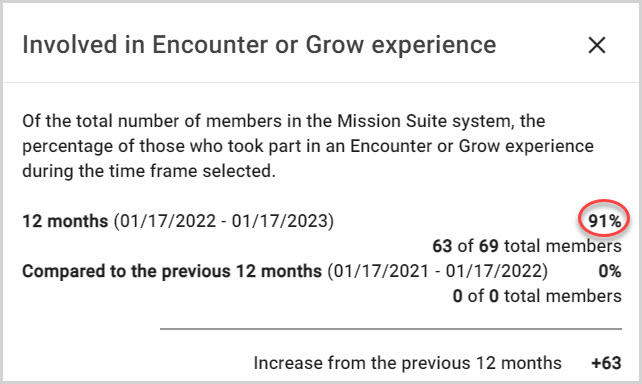
Of the total number of members in the Mission Suite system, the percentage of those who took part in an Encounter or Grow experience during the time frame selected (12 months) was 91%.
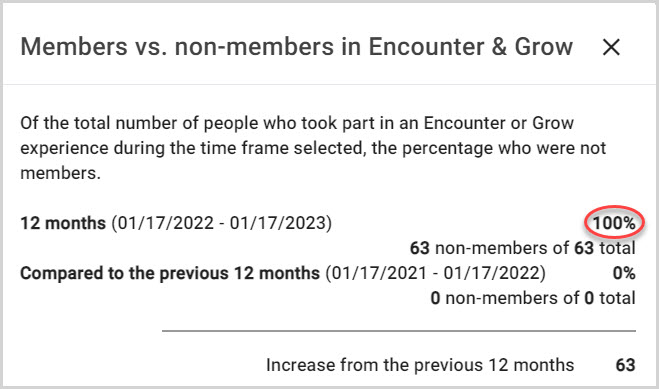
Of the total number of people who took part in an Encounter or Grow experience during the time frame selected (12 months), the percentage who were not members was 100%.
Note* Click on each statistic (91% and 100%) on the Experience Measures Reach dashboard card to view a pop up card with an explanation of the data point.
How many members were involved in an Encounter or Grow experience?
In this example there were 69 members, 63 of whom took part in an Encounter or Grow experience at some point during the 12 month time frame selected compared to 0 volunteers from the same previous 12 month period, resulting in an increase of 91% for members who had never participated in an experience before over the previous 12 months.
What percentage of those were not members?
In this example there were 63 non-members, 63 of whom took part in an Encounter or Grow experience at some point during the 12 month time frame selected compared to 0 volunteers from the same previous 12 month period, resulting in an increase of 0% for non-members who had never participated in an experience before over the previous 12 months.
Click here to learn more about the Inform Reports and Statistics Dashboard.
Note* The video is best viewed at full screen. Press Esc on your keyboard when you are finished viewing.