


About the Mission Pathways Inform Dashboard
This article provides information about the Mission Pathways Inform Dashboard.
To grow and become mission oriented, the dashboard provides data to help your parish create, execute and measure your evangelization and discipleship plans. You are able to view data on each dashboard card and click on each individual statistic for a more in depth description.
Complete these steps to locate and view the Inform Dashboard:
1. From the homepage, click on Inform Reports and Statistics.
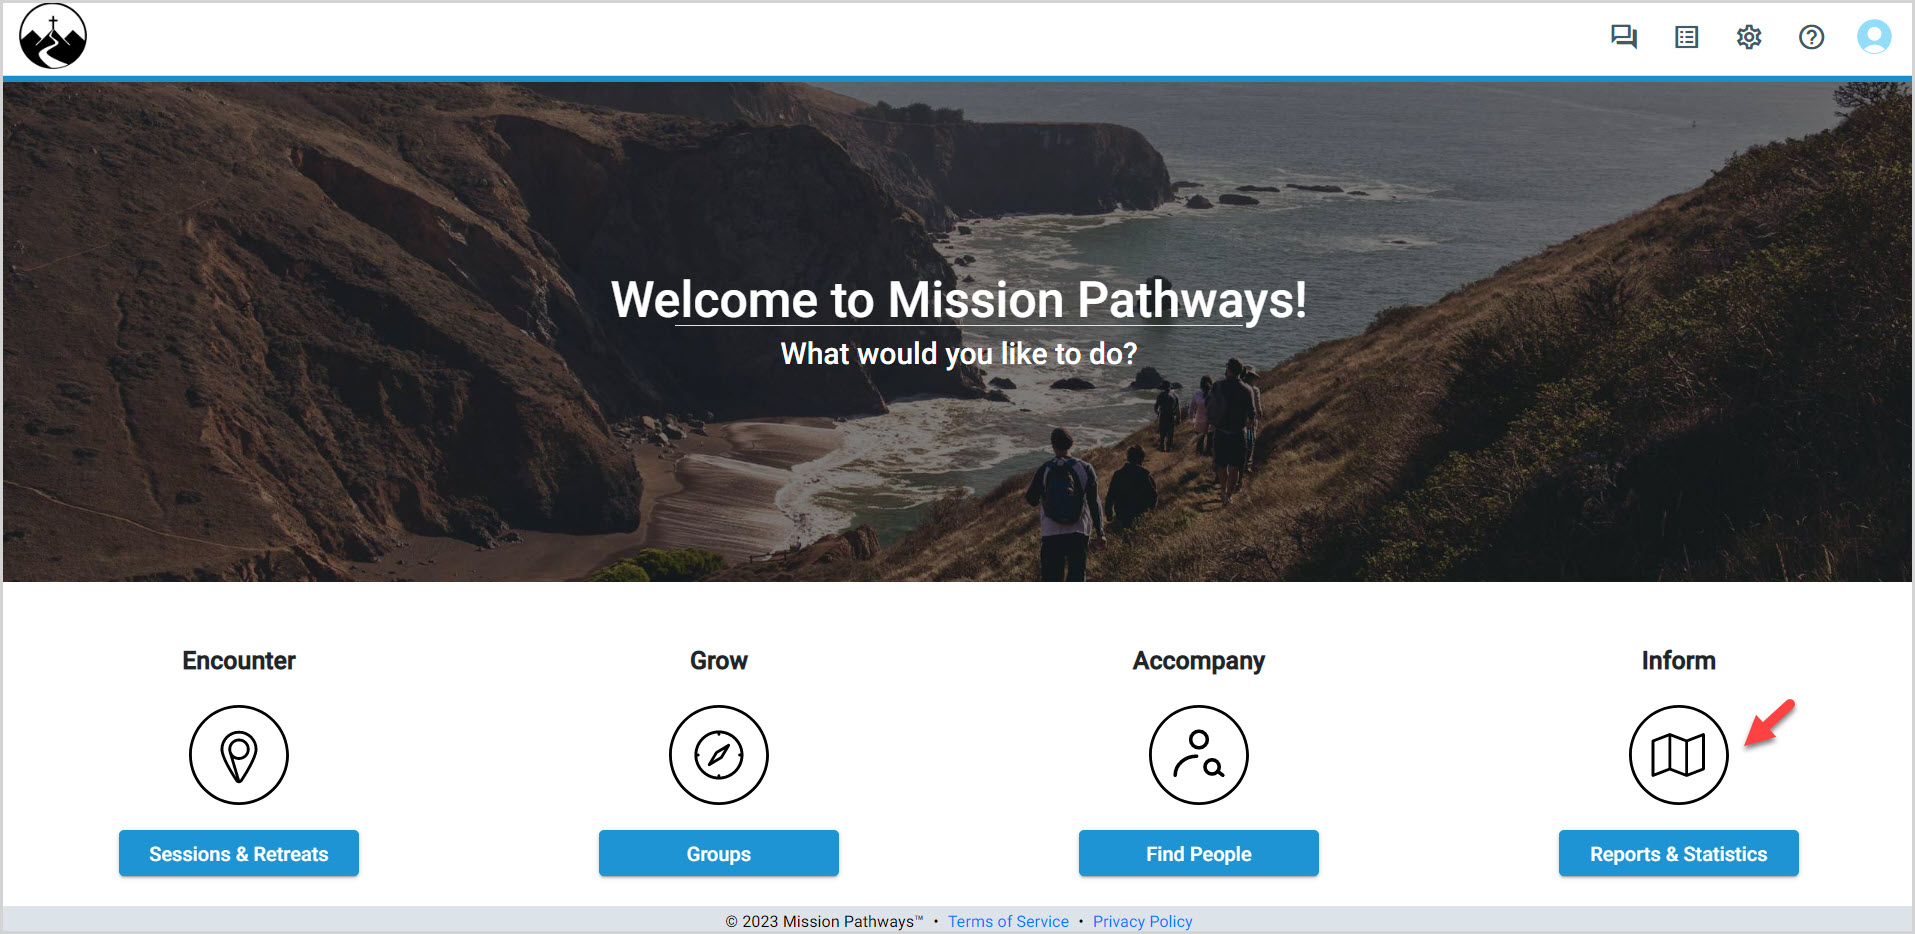
The Inform Dashboard is broken into four segments: Systems of Parish Life, Experience Measures, Encounter and Grow. (Click on these links for a deeper dive into the subject.)
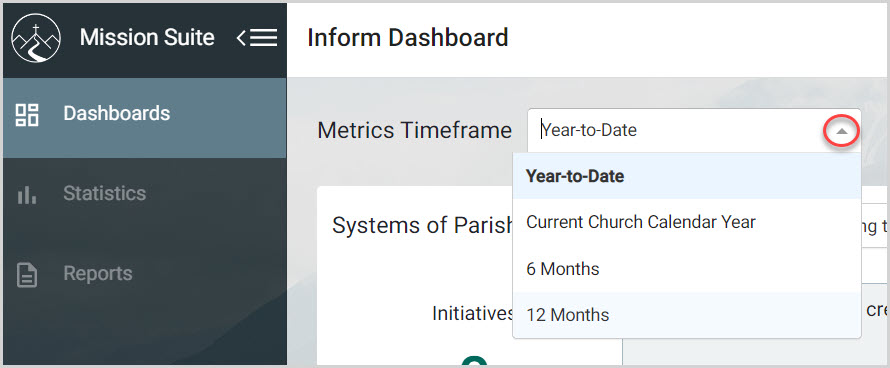
Metrics can be queried for the Current Church Calendar Year, 6 Months, or 12 Months by clicking on the drop-down menu.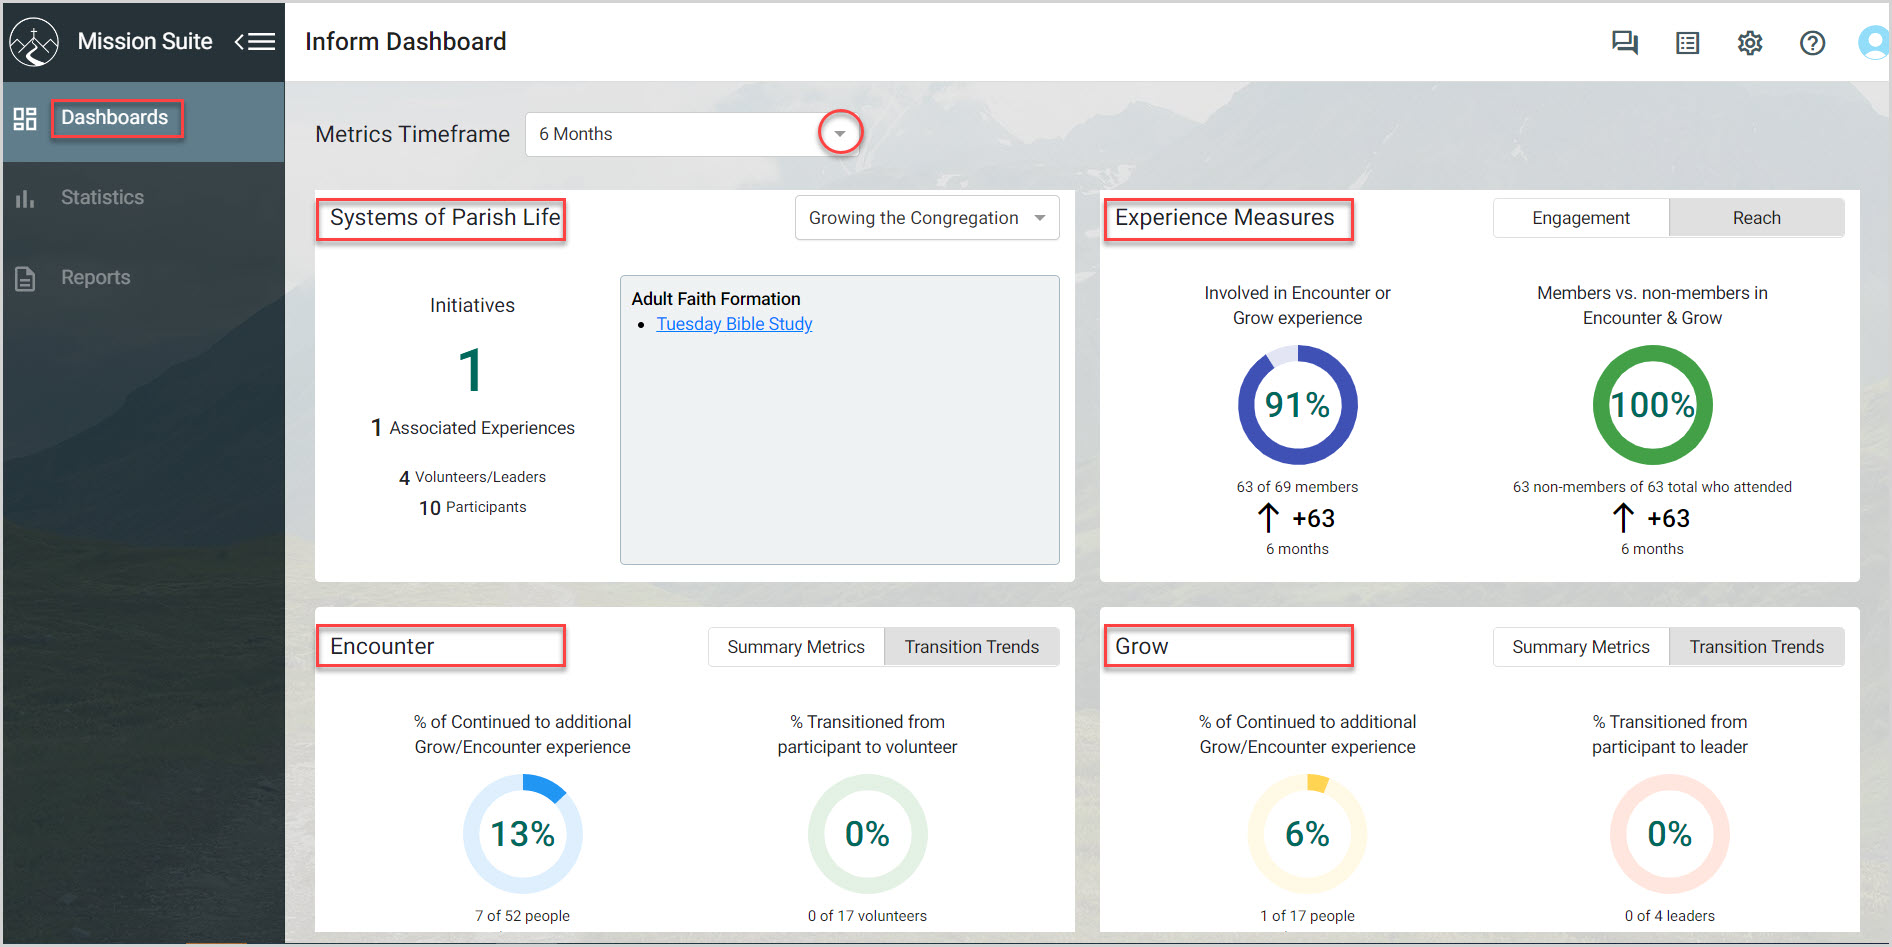
2. Click on the Metrics Timeframe drop-down menu to view the time frame options.
3. Select either Current Church Calendar Year, 6 Months, or 12 Months.
4. View the dashboard data.
Systems of Parish Life
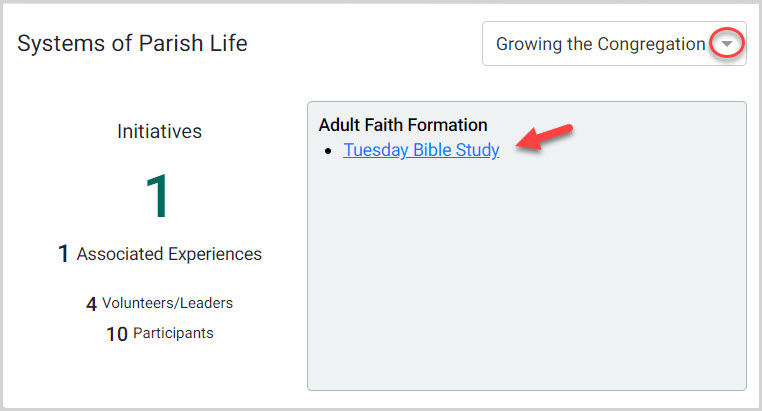
Once an initiative is created it reflects on the Systems of Parish Life card. An initiative is a plan of action to achieve health and growth for a specific church system. i.e. an area identified as key to the church mission. If there is more than one initiative it can be selected from the drop-down menu on the card.
Engagement presents the total number of participants, volunteers and leaders who took part in an Encounter or Grow experience during the time frame selected, and represents the percentage of those people who had never participated in an experience before at any time.
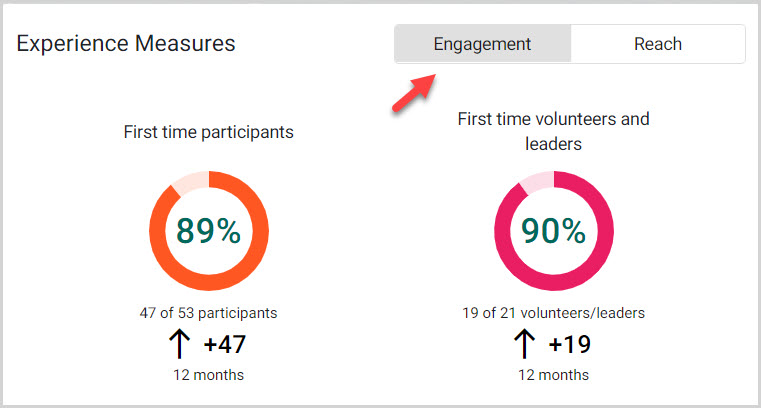
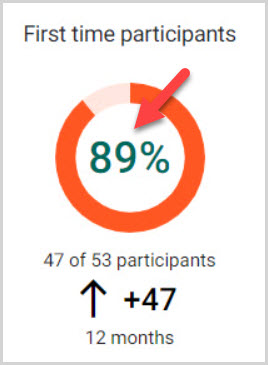
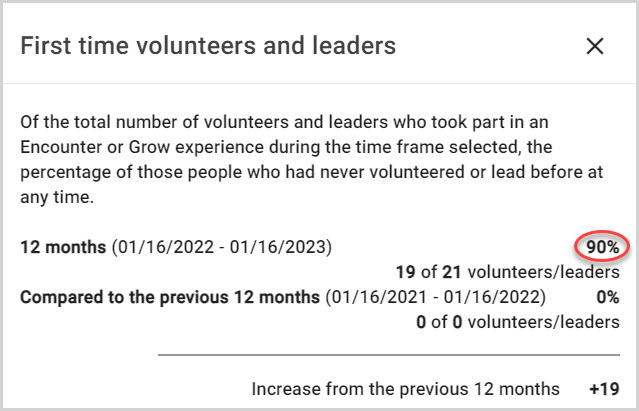
Note* You can click directly on an individual statistic to view a pop up with more information about each percentage.
As an example, we will click on the 89%.
This pop up includes an explanation of the data for 89% as it relates to first time participants during the selected time frame:
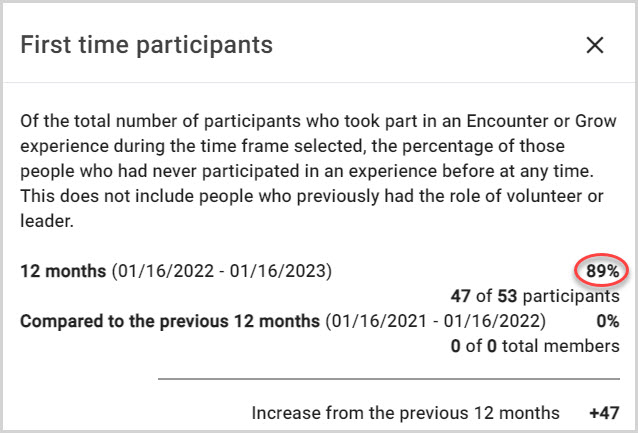
We can view more information every time we click on another statistic on any of the dashboard cards.
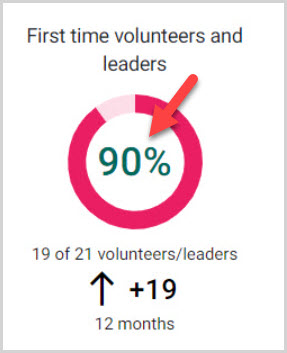
Here is the explanation of the data for 90% as it relates to first time volunteers during the selected time frame:
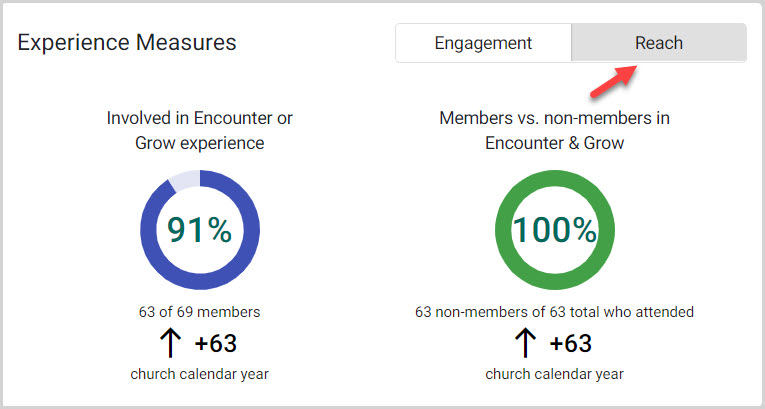
Reach presents the total number of people who took part in an Encounter or Grow Experience during the time frame selected, and reflects the percentage of those who were not members. (Remember, clicking on the statistic provides more information about the data.)
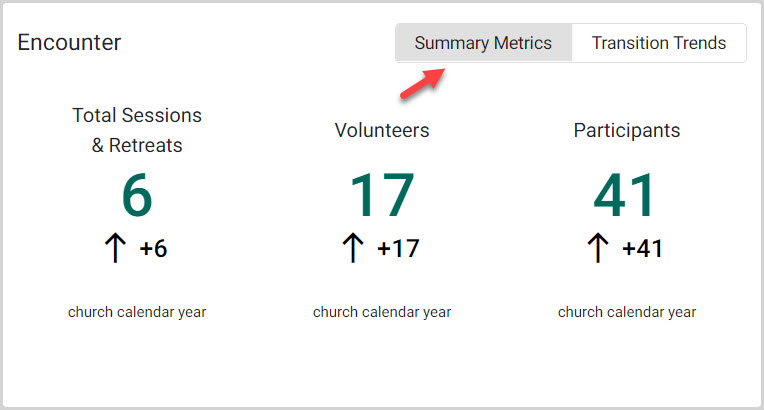
Summary Metrics provides information about the number of unique participants who took part in an Encounter experience at any point during the time frame selected indicating an increase or decrease over the same time frame the previous year.
Of the total number of people who took part in an Encounter experience during the time frame selected, Encounter Transition Trends provides the percentage of people who continued on to an Encounter or Grow activity (also during the time frame selected).
![]()
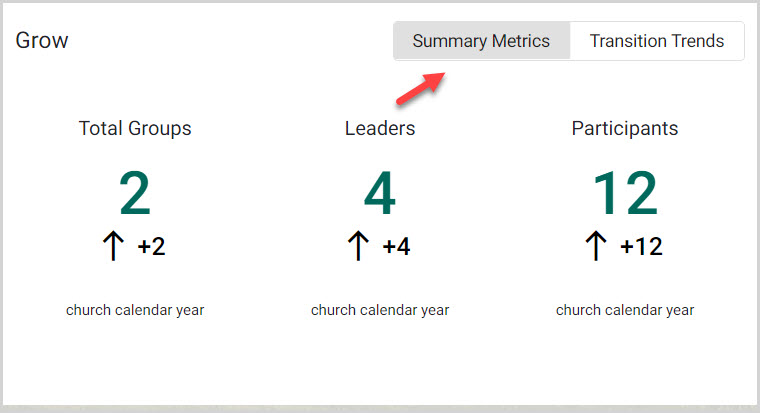
Summary Metrics provides a view of the number of unique grow leaders who lead a group at any point during the time frame selected.
Of the total number of Grow leaders, Transition Trends presents the percentage of leaders who had previously been a participant in an Grow group who have transitioned from participant to leader during the time frame selected.
![]()
Note* The video is best viewed at full screen. Press Esc on your keyboard when you are finished viewing.